

Design Failure Mode Effects Analysis in Software Engineering
A tool most often used in Automotive and Aerospace Safety Systems (ISO 26262) is my go-to when thinking about how to design fault-tolerant software regardless of the use case.

Introduction
Over the course of my career in various software and data engineering roles, I’ve gravitated toward "code-first" and "agile" methodologies. Conceptually, these approaches suit my personality and preferred working style. However, when left unchecked, they can become excuses to rush functionality at the expense of maintainability and reliability. Too often, pressure to hit deadlines leads to poorly structured code, postponed error‐handling, and a mountain of tech debt—only to have these issues resurface later at much greater cost.
The Safety‐Critical Perspective
The subtitle mentions “safety.” In regulated domains (e.g., automotive), ISO 26262 mandates a Software Failure Mode and Effects Analysis (SW FMEA) for safety‐critical systems. Often then an excuse to avoid doing these types of activities on non-safety-critical systems. And, even yet many teams treat this requirement as a checkbox exercise, shunting it to the end of a project or parachuting it into a multi‐day Design‑for‑Six‑Sigma workshop. In practice, the SW FMEA template often feels cumbersome, and its insights are rarely leveraged throughout development.
Introducing DFMEA
One of the most effective tools for architecting robust software is the Design Failure Mode and Effects Analysis (DFMEA). When applied early and iteratively, it helps teams identify potential failure modes, assess their impact, and prioritize mitigations before code is even written. In this guide, we’ll walk through a concise DFMEA exercise using a simple event‐driven C++ application (publisher → broker → subscriber) to illustrate best practices—and to highlight areas often overlooked in typical implementations.
Example Architecture
Below is a high‐level diagram of our pub‑sub system. The broker mediates communication using different queue types (mutex, SPSC, lock‑free) to transmit messages from the publisher to the subscriber:
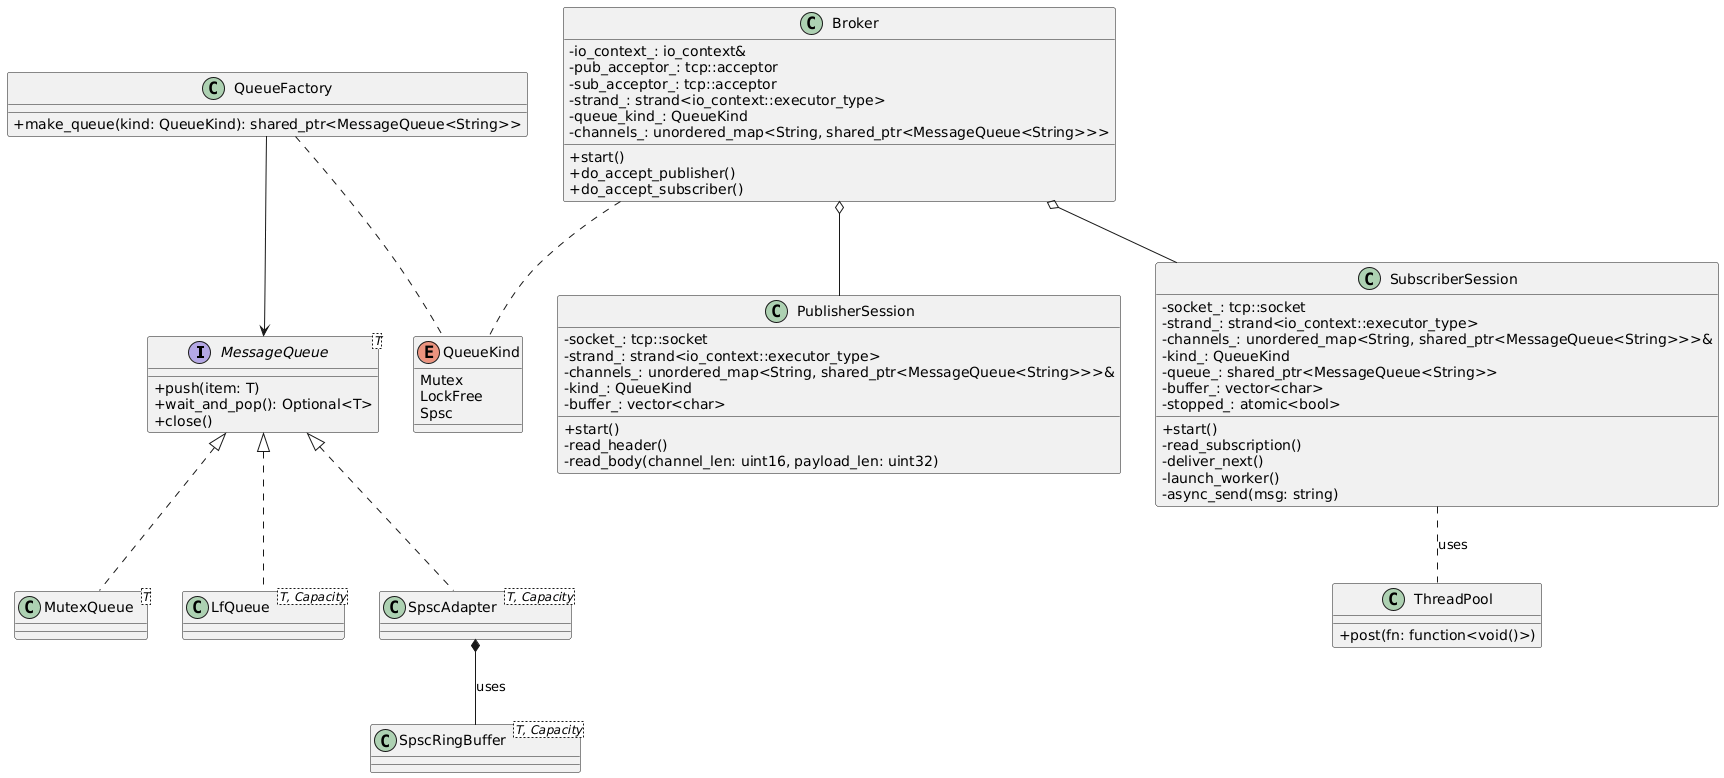
Once the system’s scope is established, we can begin analyzing the interactions between its components.
Key Questions for DFMEA
For each relationship or function call in the diagram, ask:
Purpose: What requirement does this interaction satisfy?
Failure Effect: What happens if it fails?
Nature: Is it a synchronous function call, an asynchronous callback, or a process invocation?
Failure Causes: Why might it fail? (e.g., invalid input, resource exhaustion, missing retry logic)
Data Exchange: What data is passed? Are there format or protocol requirements?
Tests: Is there an existing test covering this interaction? If not, should one be added?
These questions can be answered in any order, but they naturally lead from understanding purpose to identifying mitigations.
Annotated Diagram
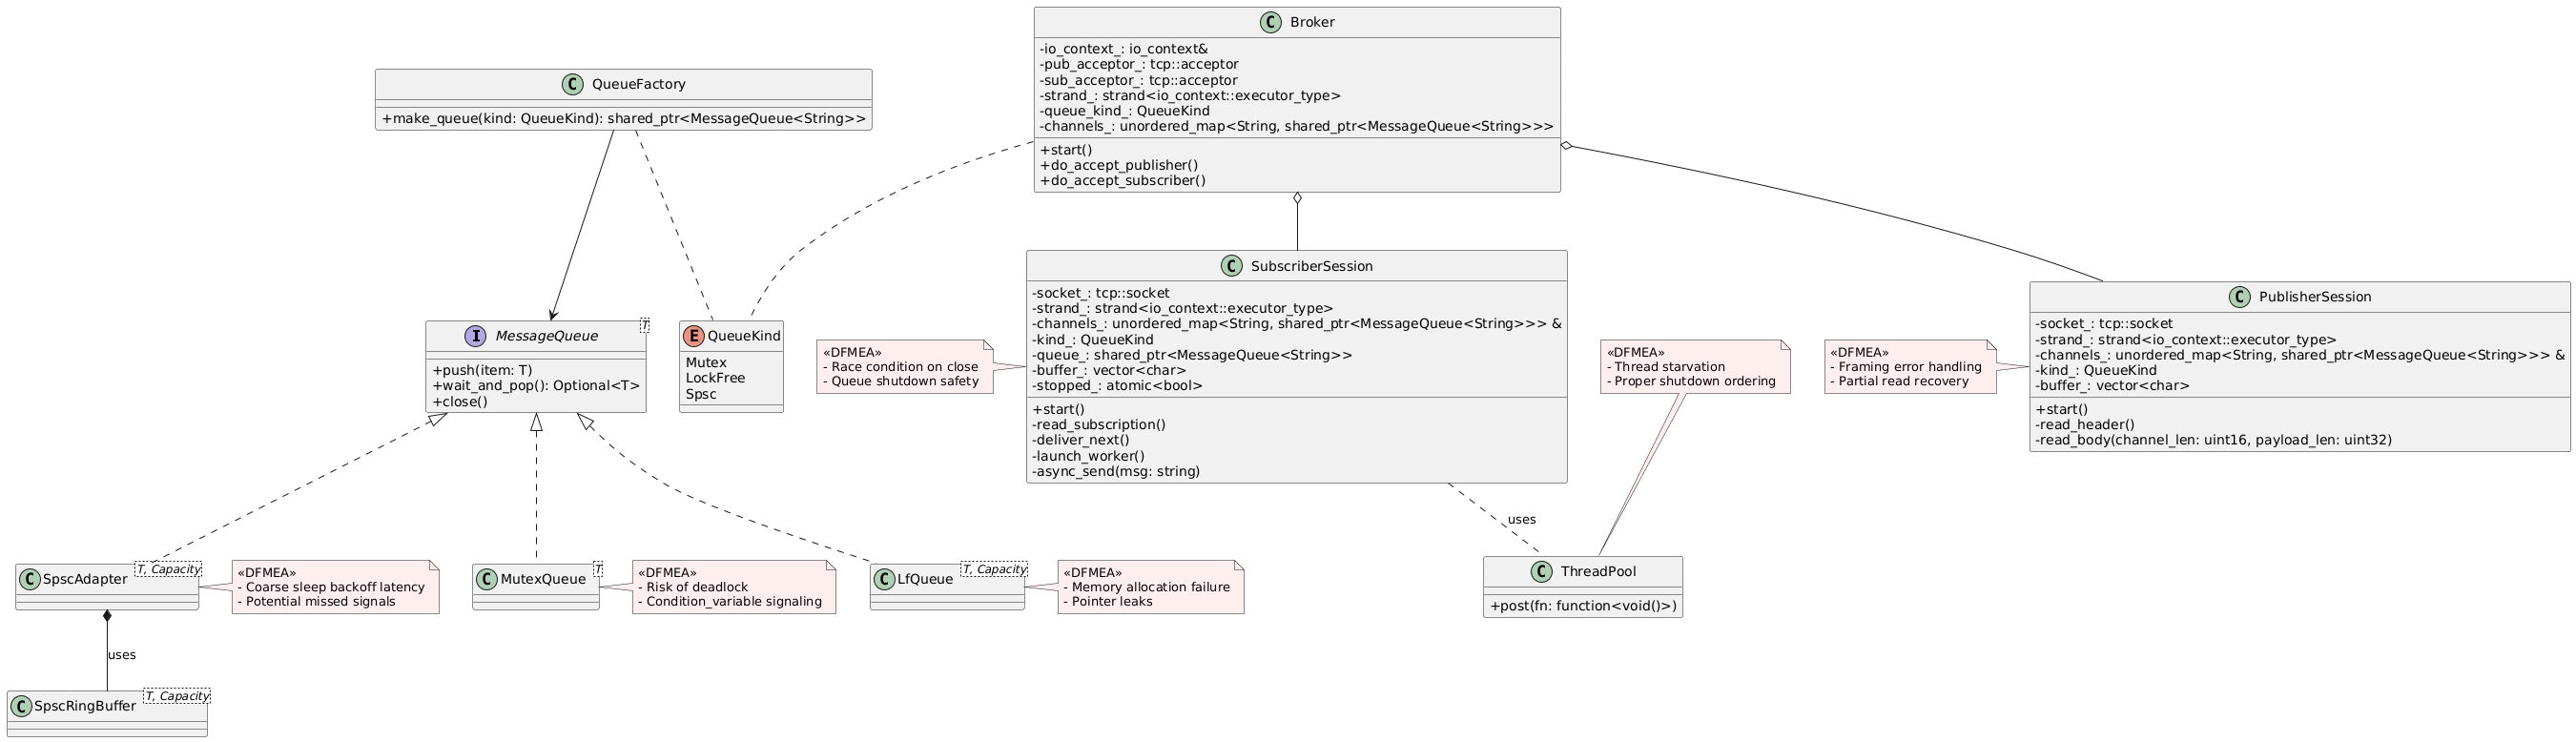
You don’t need UML tools to perform DFMEA—a whiteboard sketch can be just as effective. The goal is to visualize failure points and start thinking about how to guard against them.
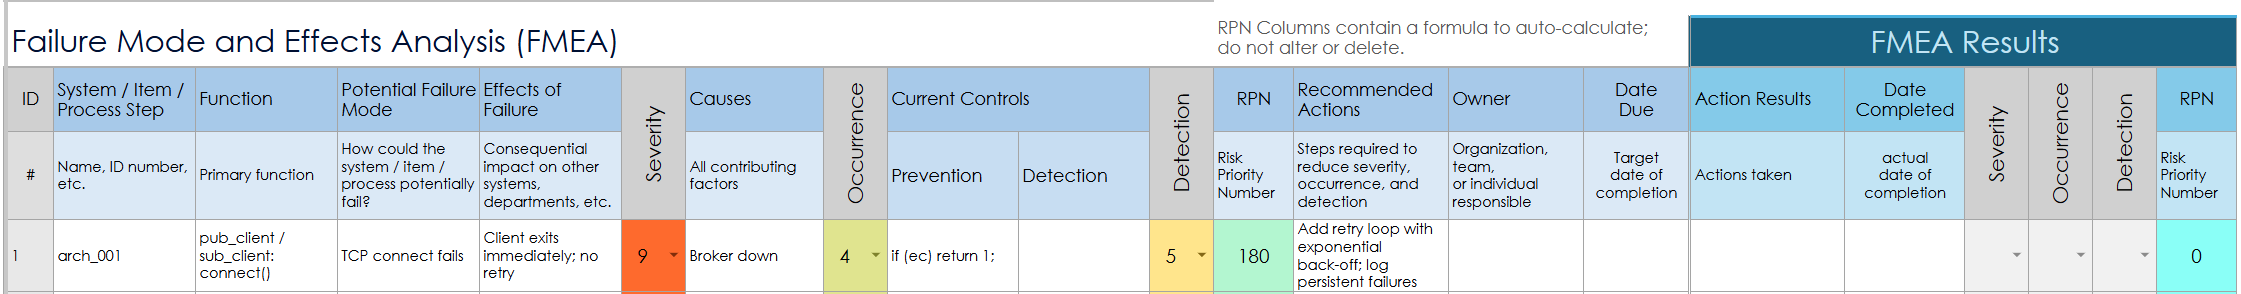
Choosing a DFMEA Template
There are many free templates online; this guide uses a Smartsheet template with built‑in calculation cells. Key sections include:
Identification: Versioning, authorship, date—essential for ISO compliance.
Function: A unique identifier (e.g., code module name and line reference).
Failure Mode: A concise description of what could go wrong.
Failure Effect: Impact on system or user (feeds into Severity).
Severity (S): Rating of how serious the effect is, based on system requirements.
Occurrence (O): Likelihood of cause; can be estimated or measured via stress tests.
Detection (D): How easily the failure is caught (code review, logging, monitoring).
Risk Priority Number (RPN): S × O × D, to help prioritize actions.
Recommended Actions: Specific design or code changes (e.g., add retry/back‑off, validate inputs, centralize logging).
Implementation Status: Tracking columns for "Assigned To", "Due Date", and "Completion".
Filling Out the DFMEA
Function Detail: Link back to code (e.g.,
Broker::enqueue()atbroker.cpp:42).Failure Mode: e.g., "Message dropped when queue is full."
Gap: our current implementation lacks retry logic and backpressure handling.
Failure Effect: Subscriber never receives critical updates; downstream state becomes inconsistent.
Severity: Assign a score based on requirements (e.g., S = 9 if loss of update could be catastrophic).
Occurrence: Could be estimated by load testing on target hardware (e.g., O = 6 for frequent high‐load runs).
Current Controls: try/catch blocks in
publish(); queue length check but no back‑off.Detection: Logged exception in console, but no centralized monitoring. (D = 7)
RPN: 9 × 6 × 7 = 378.
Recommended Action: Implement exponential back‑off retry in
enqueue(), emit structured logs to a monitoring service, and add integration tests simulating queue full conditions.Status Tracking: Create a GitHub issue, link PR, verify in CI.
Repeat for each identified failure mode.
Interpreting Scores and Prioritizing
Severity: Tied directly to system requirements (e.g., "system must recover within 2 min without data loss").
Occurrence: Measured or "SWAGged" based on bench tests.
Detection: Reflects code review, logging, and monitoring.
Higher RPNs signal where to focus initial hardening efforts. Some organizations set thresholds (e.g., RPN > 200) to trigger mandatory design reviews.
Tracking Implementation
Use the template’s columns to record:
Assigned Engineer
Due Date
Verification Method (unit test, integration test, code review)
Discipline in updating these fields ensures that DFMEA isn’t a "one‑and‑done" artifact but a living document guiding ongoing quality improvements.
DFMEA of the PubSub System
The following exercise is being performed on the project discussed in the post Exploring Queues in C++. After constructing a working proof of concept, now it was time to iron out the kinks and make it much more robust. Since Substack does not provide plugins for displaying these types of tables and documents, you can find the example online at this link: Pub Sub FMEA. It will be read only, but will give a good idea what less than an hour can accomplish.
Key numbers
Entries analyzed: 21 distinct failure modes
Severity / Occurrence / Detection ratings were assigned by worst‐case impact, likelihood, and how easy each issue is to spot.
Initial RPN range: 48 (low) to 315 (high), average ~128
Top three risks
Silent session drop in
PublisherSessionerror callbacksSeverity 7 × Occurrence 9 × Detection 5 = RPN 315
Oversized header lengths in
PublisherSession::read_headerSeverity 8 × Occurrence 9 × Detection 4 = RPN 288
TCP connect failures in the client’s connect()
Severity 9 × Occurrence 4 × Detection 5 = RPN 180
(Several other items—like invalid queue kinds and unbounded enqueue under back-pressure—also hit RPNs of 168–180.)
What we’ll work on next
Retries with exponential back-off — to handle transient network/connect hiccups
Input validation & caps — e.g. enforce max header size, cap channel-map growth, reject unknown queue kinds
Explicit cleanup & logging — close sockets in destructors, hard-fail on silent drops, instrument all error callbacks so nothing vanishes without a trace
Circuit breakers & health checks — to detect and recover from misbehaving sessions or resource exhaustion
Once those fixes go in, every post-action RPN drops to near zero—meaning the controls should neutralize these risks entirely.